- Some research firms offer technical stock ratings and charting tools to provide a meaningful indication of stock price trends.
- Technical ratings are real-time. Such technical indicators can fluctuate more frequently than fundamental ratings. By understanding technical ratings, investors may enter or exit a stock trade with better risk control in the short-term.
|
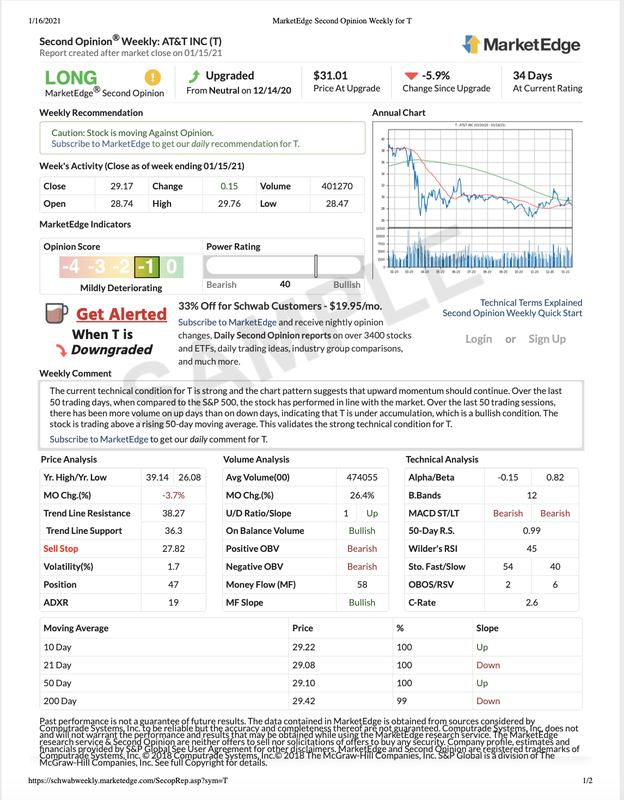
MarketEdge provides finished technical research daily on over 3400 Stocks to help investors make better trades.
Its weekly Second Opinion® takes the complexity out of professional technical analysis and boils it down to a simple Long/Neutral/Avoid opinion. It helps investors identify stocks experiencing a strong, improving, deteriorating, or weak technical condition, and provides a recommendation. MarketEdge Second Opinion® Weekly is available at many leading brokerage firms free of charge for their clients. |
|
|
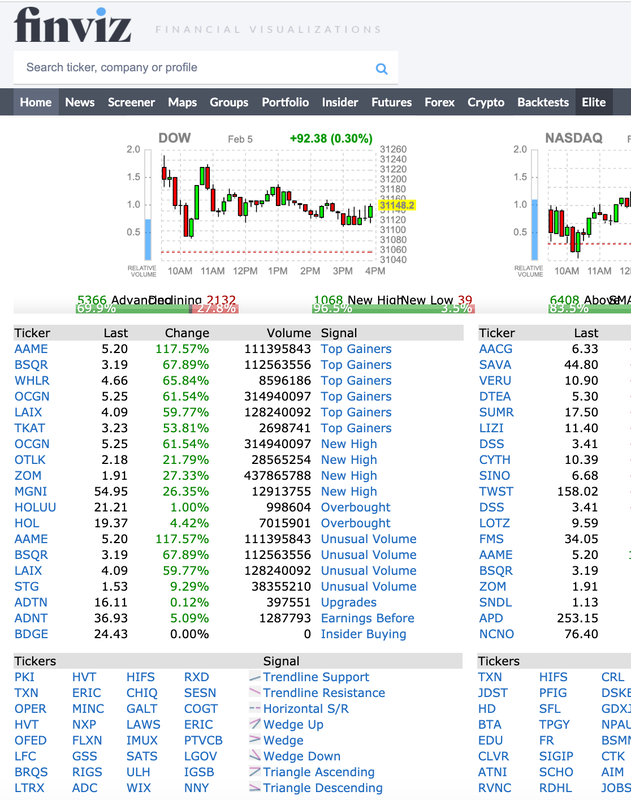
Finviz is very useful for those who want to take technical analysis into account in making stock-picking decisions.
You can screen using a wide variety of technical, descriptive, and fundamental metrics. The screener will also provide charts, quotes, and other useful information once you've drilled down and come up with results that are worth further exploration. Finviz is free, using delayed data, which will typically suffice if you run your stock screens searching for the best stock investment candidates. |
|
|
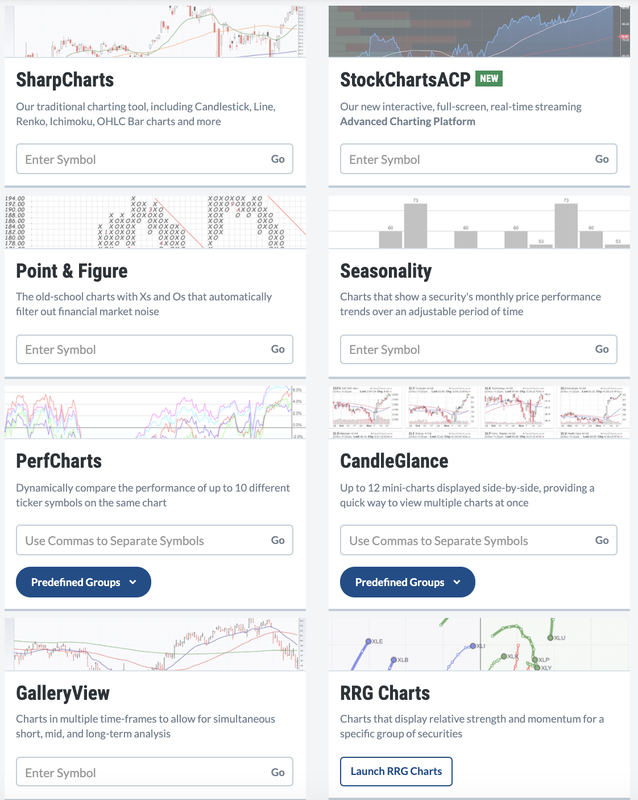
StockCharts offers a set of excellent technical charting tools. Investors have the option of finding stocks and other financial instruments that meet one’s criteria.
It has several free tools and other goodies, including predefined scans so you can find stocks with bullish or bearish chart indicators, and StockCharts TV, which analyzes live charts of current price action in the markets. More complex charting tools allow you to set additional indicators to understand stock price movements. The free StockCharts tools limit overlays and indicators and the size of the chart. |
|